NEW: View a live demo of the above charts tester code at http://dotnetcorner.ch/tools/aspnetcharts/default.aspx.
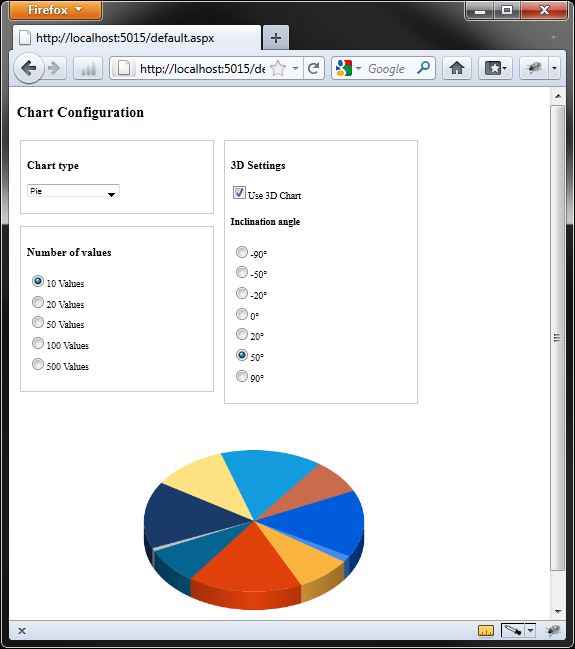
Today, I would like to introduce the new Chart Control, which was newly added to the ASP.NET 4.0 Framework. With this chart control, you can build exciting graphical charts within minutes.
Our starting position is a new ASP.NET Web Application using Visual Studio 2010.
Implement the Control Into Your Page
If you open up your default.aspx and look at the toolbox, you will find the "
Chart" Control in the section "Data":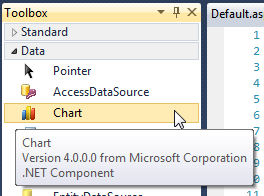
If you drag the chart control into the design-surface, Visual Studio adds some settings to the web.config. This will be done automatically so the following is just an explanation of the changes:
Web.config Changes
ChartImage Settings
At the node
<appSettings>, the following entry will be created:
Hide Copy Code
<add key="ChartImageHandler" value="storage=file;timeout=20;dir=c:\TempImageFiles\;" />
This is the configuration of the temporary storage, where the generated files should be placed at. Please be aware of the fact that the storage will use a large amount of space, depending on how many charts will be generated.
ChartImage.axd Handler
At
<system.web><httpHandlers>, the following entry will be added:
Hide Copy Code
<add path="ChartImg.axd" verb="GET,HEAD,POST"
type="System.Web.UI.DataVisualization.Charting.ChartHttpHandler,
System.Web.DataVisualization, Version=4.0.0.0, Culture=neutral,
PublicKeyToken=31bf3856ad364e35" validate="false" />
The chartimage.axd is the main-component of the chart-control. The handler will be called for each generated image.
Control-definition
In the node
<system.web><pages><controls>, the tag-definition will be added:
Hide Copy Code
<add tagPrefix="asp" namespace="System.Web.UI.DataVisualization.Charting"

assembly="System.Web.DataVisualization, Version=4.0.0.0, Culture=neutral,
PublicKeyToken=31bf3856ad364e35" />
This will add the tag-support, that we can use a
<asp:chart /> tag in our aspx pages.Reference to the DataVisualization Assembly
At the end, a reference to the
DataVisualization assembly will be added at <system.web><compilation><assemblies>:
Hide Copy Code
<add assembly="System.Web.DataVisualization, Version=4.0.0.0,
Culture=neutral, PublicKeyToken=31bf3856ad364e35"/>
Default Chart-element in aspx Page
In the aspx page, where you dragged the control in, Visual Studio will add the default chart-control to the code:
Hide Copy Code
<asp:Chart ID="Chart1" runat="server">

 <Series>
  <asp:Series Name="Series1">
  </asp:Series>
 </Series>
 <ChartAreas>
  <asp:ChartArea Name="ChartArea1">

  </asp:ChartArea>
 </ChartAreas>
</asp:Chart>
Charting Quickstart
Before we begin using the chart control, I would like to explain the properties "
Series" and "ChartAreas":| Series |
The
Series collection contains the data-points for one or more data-series. Basically for each line in the chart (consisting of multiple data-points), one series of data is required.Each series can have its own ChartType. Additionally, each series can be assigned to any ChartArea where each series can also have its own rendering-properties (for example colors, labels, etc.). |
|---|---|
| ChartAreas | The ChartArea collection can have one or more configurations which controls the rendering of a chart.Important: There must be at least one ChartArea definition that the rendering will be executed! |
Now we know that we have to add a
<asp:Series> in the property <series> which contains our datapoints. Also we have to be sure that there is at least one <asp:ChartArea> at the <ChartAreas> defined, otherwise we would get just a white picture.
After changing the chart-control code to the following:
Hide Copy Code
<asp:Chart ID="cTestChart" runat="server">
 <Series>
  <asp:Series Name="Testing" YValueType="Int32">

   <Points>
    <asp:DataPoint AxisLabel="Test 1" YValues="10" />
    <asp:DataPoint AxisLabel="Test 2" YValues="20" />

    <asp:DataPoint AxisLabel="Test 3" YValues="30" />
    <asp:DataPoint AxisLabel="Test 4" YValues="40" />

   </Points>
  </asp:Series>
 </Series>
 <ChartAreas>
  <asp:ChartArea Name="ChartArea1">
  </asp:ChartArea>

 </ChartAreas>
</asp:Chart>
We will get this output in the rendered output page:

So we successfully created our first chart!
More Information
The chart control in the ASP.NET 4.0 Framework is a big and comprehensive control, so to explain the whole control would be too much for a short blog-post :)
Also, there are already many good introductions and tutorials about the chart control, so I will give you a short list on what you can look at next:
- Short Video-introduction into the charts component: http://www.asp.net/aspnet-4/videos/aspnet-4-quick-hit-chart-control
- Blog-Entry of Scott Guthrie: http://weblogs.asp.net/scottgu/archive/2010/02/07/built-in-charting-controls-vs-2010-and-net-4-series.aspx
- Article series from 4guysfromrolla.com:
- Introduction: http://www.4guysfromrolla.com/articles/072209-1.aspx
- Chart-Data Plotting: http://www.4guysfromrolla.com/articles/072909-1.aspx
- Chart Rendering: http://www.4guysfromrolla.com/articles/081909-1.aspx
- Sorting and filtering: http://www.4guysfromrolla.com/articles/092309-1.aspx
- Nested reports / clickable charts: http://www.4guysfromrolla.com/articles/102809-1.aspx
- How-To: Chart Control with ASP.NET MVC: http://code-inside.de/blog/2008/11/27/howto-aspnet-chart-controls-mit-aspnet-mvc-nutzen/ (German, sorry :))
So I hope I was able to give you a short overview about the new ASP.NET Charts Control! If you have any questions or information, please just leave a comment! I'm happy to read any suggestions and I will try to answer every question!
Now, have a nice day and always happy coding! :)
-------------------------------------------------------------------------------------------------------------------
Source: https://www.codeproject.com/articles/235117/asp-net-4-0-chart-control
-------------------------------------------------------------------------------------------------------------------
Source: https://www.codeproject.com/articles/235117/asp-net-4-0-chart-control


